
Tags that this post has been filed under.
If you've ever looked at a Lighthouse report for your website to get an idea of its performance, congratulations, you're already in the minority! Keeping an eye on the performance of your website over time, rather than just when it's released, can help you keep on top of any issues before they create long-term effects. Catching the impact of that script a third-party tool asked you to add to every page, or that huge image one of your editors innocently uploaded, can go a long way to ensuring your pages stay as fast as they should – and that users have the best possible experience.
There's been a lot of noise lately about the impact of Core Web Vitals, which include performance metrics you can measure in Lighthouse reports, and their impact on organic search positions. There's no guarantee that monitoring your site's performance will have a positive effect on organic search, but there is definitely a chance you'll catch anything that could have a negative effect.
What is Lighthouse scoring?
Here's the definition from Google themselves:
Lighthouse is an open-source, automated tool for improving the quality of web pages. You can run it against any web page, public or requiring authentication. It has audits for performance, accessibility, progressive web apps, SEO and more.
Most people who aren't in some sort of web development role will do their Lighthouse testing in PageSpeed Insights. When you run a test there, you'll get an overall score out of 100 for Mobile and Desktop, as well as various other metrics. The main ones we'll worry about for now are those listed under Lab Data, as they're the ones we can simply keep track of over time.
Why is it important?
The impact of speed on a website is well documented, with various studies showing similar findings:
- Walmart found that for every 1-second improvement in page load time, conversions increased by 2%
- COOK increased conversions by 7% by reducing page load time by 0.85 seconds
- Mobify found that each 100-millisecond improvement in their homepage's load time resulted in a 1.11% increase in conversion
Users expect a site to respond quickly and to get on with their next action seamlessly. Any deviation from that is a reduction in user experience that will always be followed by a reduction in conversion rate.
What is the benefit of automated regular Lighthouse testing?
Running the odd test now and again is good. Running them fairly regularly is better. Keeping a record of the scores over time is even better. What you really want, though, is to make sure you're testing at regular intervals and keeping those records consistent. What a great opportunity for some automation. By making this a machine task instead of a human one, we can increase the number of tests we do, how reliably we do them, and, subsequently, how useful the information is.
How we implement it
There are many ways to get this done, but here's what we generally do for any client who wants this level of performance testing:
1. Create a small Django project
This forms the basis of all of the code. We have a base code repository, which can be quickly adjusted for a given client's needs. This includes:
- A
Resultmodel, which is used to store the relevant aspects of the Lighthouse report. - A
Urlmodel, which is used to define all the URLs you might want to include in your tests. It's no good only testing your homepage if your blogs and service pages are doing the heavy lifting for a user. - A management command, which runs the lighthouse command on each
Urland stores theResult.
2. Deploy to a Heroku project
This gives us a quick and easy way to spin up a server that does everything we need. We can run this project on a free server instance with a free database attached, and keep it completely separate from anything else the client is running. Note that it's entirely possible to integrate this work into existing servers and deployment methods; this is just our go-to for a typical project.
As part of this deployment, we'll set up the URLs to be tracked for a client so that as soon as we schedule the commands, we'll start gathering data straight away.
3. Schedule the management command to run every hour from Heroku
This is as simple as using the Heroku Scheduler add-on to run the command at a set time every hour and then waiting for the data to roll in.
How to use the data
Having the data is all well and good, but having it stored in a database somewhere means it'll add precisely nothing to your knowledge. All data is nothing without a way to visualise, understand, and act on it. Here are a few ways you could use the information:
1. Data Studio
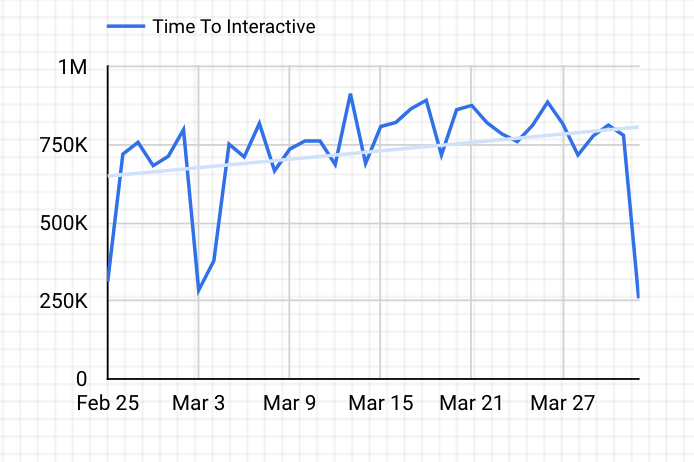
Perhaps the easiest way to visualise your Lighthouse data would be to attach your database (whether that's Heroku or another) to Data Studio to set up quick graphs like this one to show that the trend of 'Time To Interactive' is getting longer – something to work on in this instance:
Another useful aspect of Data Studio is the ability to schedule it to package up the report and send it in email form to anyone who needs to see the data. This is useful for regularly keeping the data front of mind.
2. Internal charting tool
Another option is to build custom charts into existing internal tools. This is really only worthwhile if you already have those internal tools to add to; otherwise, Data Studio is a great option.
3. Alerts for abnormal results
One of our favourite ways to use this data is to set up alerts for abnormal results. In our example of a Django project, we'd set up another management command to run after we'd taken each result. We'd compare that result to the average of the past seven days, and if it was significantly outside of a 'normal' range, we'd fire off an email to those who needed to know.